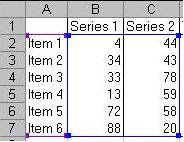
Lets say, there is a stacked column chart in Excel created using the data as shown:
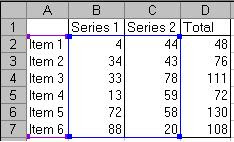 Now change the source data of the chart to include column D as shown below:
 The Total column will appear as show above.
Next, right-click on the new "total" series and change the Chart Type to Line and the resulting chart is shown below:
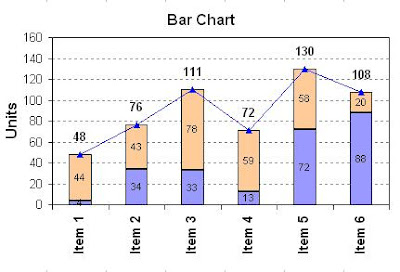 Next, double-click on the Line and set the Line color as "None" and Marker as "None" under the "Patterns" tab.
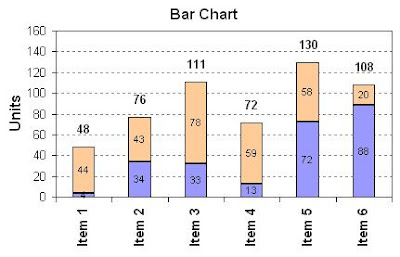
Go to "Data Labels" tab and select "Value" checkbox, and the resulting final chart will look like this:
 Hope you found this tutorial helpful.


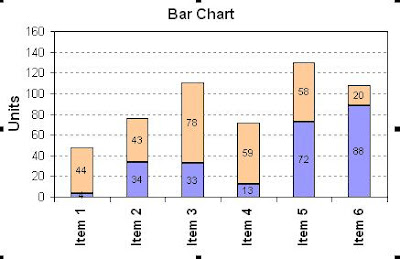
Now, we want to display totals, for example 34 + 43 = 77 at the top of the stacked columns. In stacked column chart, Excel does not allow the "Outer End" option of Data Label position.
To overcome this limitation, create a "Total" column in the data table as shown:


Next, right-click on the new "total" series and change the Chart Type to Line and the resulting chart is shown below:

Go to "Data Labels" tab and select "Value" checkbox, and the resulting final chart will look like this:


No comments:
Post a Comment